Revenue City shows every leak in a company as a building on fire, with dollars a month.Explore the demo ›

For PE platforms, franchise systems and multi-location operators

Find the leaks in every company you own.

We connect read-only to each company’s phones, CRM, ad accounts and QuickBooks, whatever it runs, match every lead to the job and the invoice, and put every company on one screen with the dollars leaking at each one. No migration needed.
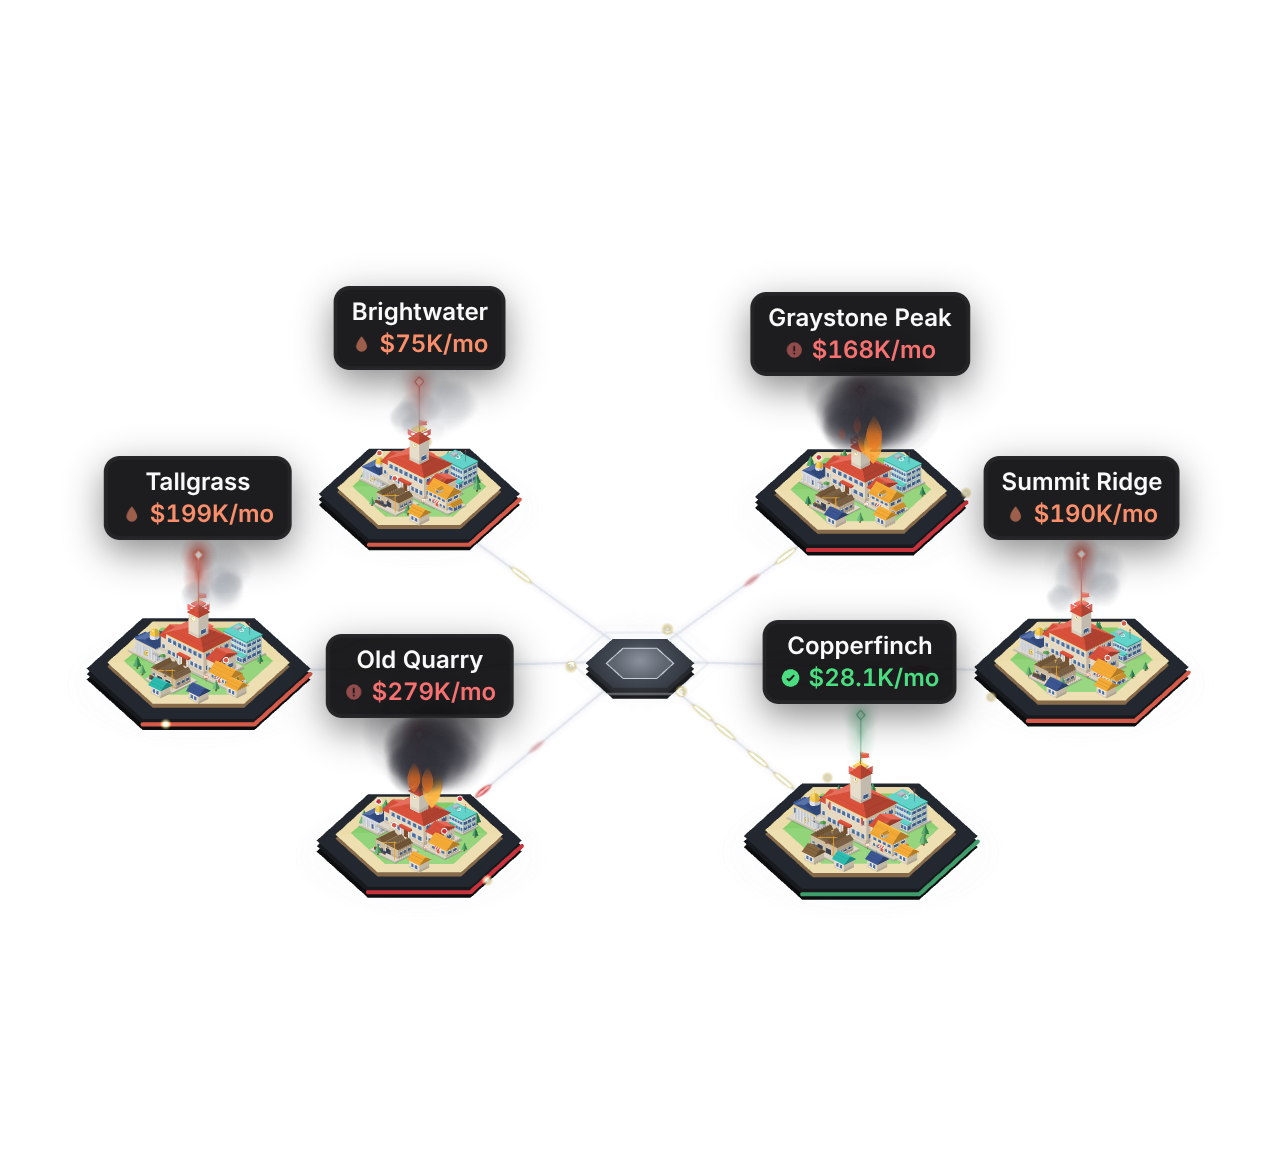
Revenue City demo: six synthetic roofing companies on one map. Old Quarry and Graystone Peak are on fire; each is labeled with its monthly leak in dollars.
Demo data Synthetic companies. Open the demo to look around.Explore the demo ›

We sit on top of whatever each company already runs, so there is nothing to replace or change.

  • CallRail
  • JobNimbus
  • AccuLynx
  • QuickBooks Online
  • Google Ads
  • Meta lead ads coming later
  • CSV import
  • ServiceTitan by export
8.2 s
to match 50,000 calls to leads and jobs
100%
Tier 1 match precision on named callers
6
direct connectors
0
systems to replace
How we measured these
  1. 8.2 s to match 50,000 calls to leads and jobs. Matching engine benchmark on synthetic data (50,000 calls), recorded 2026-11-11. The target was under 60 seconds.
  2. 100% Tier 1 match precision on named callers. Synthetic test company with planted answers: every Tier 1 match on a named caller was correct. Recorded 2026-11-11.
  3. 91.7% call category accuracy on our offline eval set. Offline fallback classifier on a 60-transcript synthetic eval set. The live AI model eval has not been run yet.

Command centre

Every company and every leak on one screen

The same dashboard your team opens on Monday. Pick a company, switch the scenario, hover the charts. Every number matches the city.

Leaking per month

$939K

base case

Cash collected, Oct '26

$7.84M

12-month trend

Overall score

65 of 100

vs benchmark targets

Recovered so far

$165K/mo

fixes already in place

Lead to cash volume per month

Leads
3,106381 leaking
Leads reached
2,228100 leaking
Estimates
1,426151 leaking
Jobs sold
49910 leaking
Jobs completed
469

Cash collected and leaking by month

Nov '25Jan '26Mar '26May '26Jul '26Sep '26
Cash collected Leaking, base caseHover the chart for a month

Leak by department base case, per month

  • Call Center$434K
  • Sales$262K
  • Billing & Collections$100K
  • Marketing$73.6K
  • Production$69.4K

Departments by status

22flagged
  • Critical4
  • Leaking8
  • Warning10
  • Healthy8

Biggest findings

  1. $99.0K/moSales · Tallgrass
    112 estimates worth $1444.8K have had no follow-up in 14+ days

    Why Joel closes 23% of estimates (target 38%), and has 32 estimates worth $413K with no follow-up in 14 days.

    Fix Start a 3-touch follow-up sequence and review ghost estimates weekly

    See why in your own numbers
  2. $96.7K/moCall Center · Old Quarry
    After-hours calls go to voicemail: only 10% answered after 6pm (benchmark: 60%)

    Why After hours and weekends: 10% of 188 lead calls are answered live (target 60%), so 169 are missed each month.

    Fix Turn on after-hours answering with live booking

    See why in your own numbers
  3. $73.0K/moSales · Old Quarry
    56 estimates worth $924K have had no follow-up in 14+ days

    Why Joel closes 22% of estimates (target 38%), and has 16 estimates worth $264K with no follow-up in 14 days.

    Fix Start a 3-touch follow-up sequence and review ghost estimates weekly

    See why in your own numbers
  4. $66.6K/moCall Center · Summit Ridge
    After-hours calls go to voicemail: only 30% answered after 6pm (benchmark: 60%)

    Why After hours and weekends: 30% of 209 lead calls are answered live (target 60%), so 146 are missed each month.

    Fix Turn on after-hours answering with live booking

    See why in your own numbers

Demo data Northline Home Partners (synthetic): 6 roofing companies, as of 2026-10-31. Same numbers as the Revenue City.

Lead journey

Where last month’s leads went, step by step

Every lead has four steps to become a finished job. Each row shows how many made it through, how many dropped off the way they do at any well-run roofer, and how many leaked out beyond that.

Leads in, per month
521
Became finished jobs
42
At benchmark rates, the same leads would finish
148
Lost beyond benchmark along the way
222
  • Moved to the next step
  • Normal drop-off (a well-run roofer loses these too)
  • Leak: lost beyond benchmark
  1. 1
    Reach the leadDid anyone talk to them?
    of 521 leads
    57%made itbenchmark 84%

    Why After hours and weekends: 10% of 188 lead calls are answered live (target 60%), so 169 are missed each month. See why in yours

  2. 2
    Get to an estimateDid they get an inspection and a price?
    of 297 leads reached
    54%made itbenchmark 68%

    Why Web form callbacks: it takes 88 minutes to reach a new lead (target 10 minutes), and 54% of them get an appointment (target 68%). See why in yours

  3. 3
    Sign the jobDid the estimate turn into a signed job?
    of 160 estimates
    29%made itbenchmark 52%

    Why Joel closes 22% of estimates (target 38%), and has 16 estimates worth $264K with no follow-up in 14 days. See why in yours

  4. 4
    Finish the jobWas the signed job built?
    of 46 jobs sold
    91%made itbenchmark 96%

    Why Crew B takes 32 days from signed to installed (target 18 days), and 7.4% of its jobs need a return trip (target 3%). See why in yours

Demo data Each row is one step. The bar is every lead that reached it; red is what a well-run roofer would not have lost. Hover a row.

See the same four steps for each company you own.

Cross-system matching

Finds the jobs a single-system report misses

Each tool sees its own piece. We match calls, CRM jobs, QuickBooks invoices and ad spend, and find the jobs that fell between them.

A single-system report

What the CRM says

CRM only
Leads212
Inspections booked148
Jobs signed61
Close rate29%
Signed revenue$866,200

Looks fine. It only knows what someone typed into the CRM.

Every system, matchedDemo data

What actually happened

CallsCRMQuickBooksAd spend
New-lead calls (call tracking)318
Became a CRM lead212
Missed, never returned, never in the CRM41 calls
At risk from those calls (base case)$168,838
Signed in the CRM / invoiced in QuickBooks61 / 57
Signed, not invoiced4 jobs, $58,400
Ad and lead spend / cost per signed job$31,200 / $511

41 x 29% close rate x $14,200 average job = $168,838. Every line drills down to the records.

Your software

Nothing gets replaced. We add one layer on top.

At each company a lead already moves through software it pays for: an ad or a lead service, the phones, the CRM, the books. We read from each one and match them up, whatever the company runs.

One layer over all of itReads each system and matches every lead to its job and its invoice. Updates your CRM only when a rep approves the change. Replaces nothing.
  1. Where leads come from

    • Google AdsReads, and uploads booked jobs with your OK
    • Local Services AdsDirect connector
    • Meta lead adsComing later
    • AngiBy CSV or lead email
    • HomeAdvisorBy CSV or lead email
    • ThumbtackBy CSV or lead email
    calls or fills in a form
  2. Phones and forms

    • CallRailDirect connector
    • Website formsDirect connector
    • DialpadBy call log export
    becomes a job
  3. CRM

    • JobNimbusReads, and updates with rep approval
    • AccuLynxReads, and updates with rep approval
    • Any CRM by CSVBy CSV export
    • ServiceTitanBy CSV export
    gets invoiced and paid
  4. Books

    • QuickBooks OnlineDirect connector

We are not replacing anything. Your team keeps the phones, the CRM and the books it uses today. We add one layer over them.

Your software is not on here? We can still put a layer over it, starting from its exports.

Answer receipts

Ask a plain question. Get the answer with its receipts.

Every answer shows the records it used: the calls, the CRM jobs, the invoices and the ad spend, plus the dollar figure, the math, and the fix worth doing first.

  • No number without a source
  • Ask about one company or the whole portfolio
Ask it anythingDemo data

Why did Branch 2 sign fewer jobs in October?

Branch 2 signed 9 jobs in October, down from 15 in September. The gap is the phones, not the marketing: lead volume and ad spend were flat.

$57,652 at risk this month

14 unreturned calls x 29% close rate x $14,200 average job (base case)

Recommended fix: cover the phones from 4 to 6 pm on weekdays and turn on callback tasks for missed new-lead calls in JobNimbus. Set up in the tools you already pay for.

Drill-down

Click any dollar figure. See the exact calls and jobs behind it.

No black boxes. Every leak opens to its records and the assumptions used, so the office can check it and a rep can fix it the same day.

Sold, not invoiced · last 30 daysDemo data

Find out what each company is leaking before your next board meeting.

We connect read-only to the systems you already run and show you the first leaks in dollars, with the records behind them.

Leak by department

See which department leaks the most

Each department is a bar hanging below the zero line, as deep as the dollars it leaks each month, colored by how far it is from its target. Pick a company, then hover a bar to see the numbers behind it.

Old Quarry Roofing · leaking per month-$279K
$0-$50.0K-$100KCall Center-$138KSales-$73.0KMarketing-$25.7KBilling & Collections-$25.7KProduction-$16.1K

Leak simulator

Run your own numbers

Move the sliders to match your company. The funnel and the dollars update as you go, and the fix slider shows what returning missed calls is worth.

Inbound calls
600
New-lead calls
270
Missed
41
Never returned
24
Lost per month$85.0K$1.02M a year
Recovered with the fix$70.9K$851K a year

lost = calls x new-lead share x missed x (1 - returned) x close rate x job value

These are estimates from your inputs. The snapshot uses your real calls and jobs.

Read-only by default

Nothing to switch. Nothing for your team to learn.

Live connections, plain exports, or a diligence data room. The same matching and the same report either way.

  • Read-only access to your systems
  • Every number traced to the records behind it
  • Fixes run in the tools you already pay for
your systems
sources
  • CallRail
  • JobNimbus
  • AccuLynx
  • Google Ads
  • Local Services Ads
  • QuickBooks Online
read-only API access
one ledgerEvery lead matched from first call to collected invoiceOne lead per person per 7 days · leaks priced in dollars
every number drills down
what you get
  • Revenue City
  • Audit PDF
  • Weekly email
  • Hot-lead alerts

Synced on a schedule. Nothing in your systems changes unless you turn on a write feature.

Security

Built so your IT person and your CFO can say yes

Read-only by default, encrypted credentials, isolation per company, access logs, and your data exportable any time.

We read from your phones, CRM, ad accounts and QuickBooks. Two features can write, and both are off until you turn them on.

  • Google Ads: booked and signed jobs uploaded to your own account, only after your written OK
  • CSR Assist: call notes and follow-ups written to your CRM only when a rep approves each one
  • Neither ever contacts your customers
  • JobNimbus
  • AccuLynx
  • Any CRM by CSV
  • ServiceTitan by export

Any CRM

CRM-neutral from day one. Keep the CRM you run; we read it and check it against your phones and QuickBooks.

CallRailJobNimbusAccuLynxQuickBooksGoogleLSA

6 direct connectors

Calls, CRM jobs, ad spend, lead forms and invoices, matched on one ledger.

  1. Read-only access granted
  2. Stages and locations mapped
  3. First dollar figures in the first session
  4. Full 90-day audit

White-glove onboarding

We connect your systems, check the matches and walk you through the first audit. No setup wizard, no training for your staff.

Interfaces

One set of numbers, shown the way each person reads

The live 3D city, the tables, the PDF and the emails all read the same numbers.
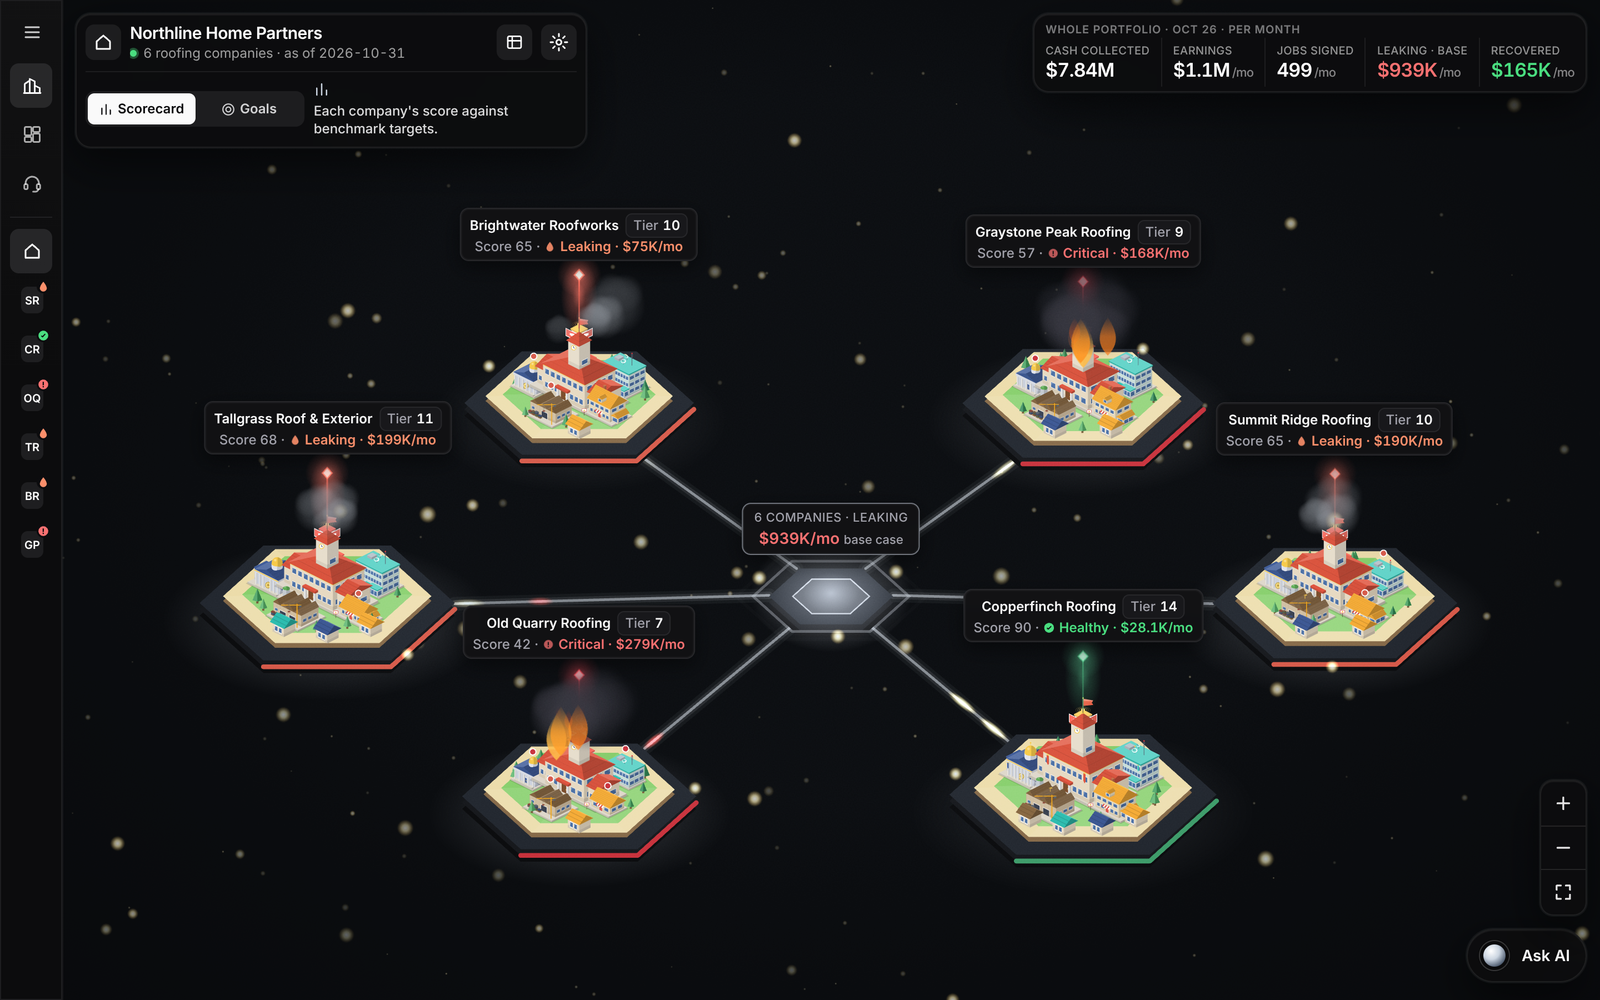
Revenue City, the six-company demo portfolio as the app opens it

Demo data The Revenue City app, running on demo data. Drag to look around, click a company to open its town, or switch to the scorecard.

See every company on day one, with no migration.

Start with one company or one deal, then add the rest of the portfolio.

Use cases

One scoreboard for every seat at the table

Operating partner

Every company on one screen, with change since close and the value-creation estimate.

Deal team

A lead-flow and revenue quality report on a target in about two weeks, from data-room exports.

Franchisor

Every location measured the same way, checked against the money in the bank.

Platform CEO

Which company is leaking the most, and whether the fix is the phones, sales or billing.

Integration lead

Measure the migration: each company against its baseline while systems change.

Owner preparing to sell

See what a buyer will see, and fix it first.

The referee, not the agency

We don’t run your ads. We tell you what they actually produced.

We don’t manage ad spend, write ad copy, build campaigns or sell leads. Your in-house marketer gets verified numbers to show the owner, and agencies can show their clients reporting checked by us.

How we check the numbers
$0ad spend we manage

Read-only by default. Nothing changes without your yes.

Our conflict rule

Questions

What platforms ask first

Do our companies have to switch software?

No. We read whatever each company runs: CallRail or another phone system, JobNimbus, AccuLynx or any CRM by export, Google Ads, lead services and QuickBooks Online.

Do we need the seller’s logins for diligence?

No. The exports in the data room are enough. Live read-only connections come after close.

Is this a quality of earnings report?

No. It is an operational and marketing analysis. It complements your QoE provider; it does not replace them.

Do you run ads or sell marketing?

Only if you choose to: AI Roofing Marketing runs your Google Ads with every change waiting for your OK, graded on the same scoreboard as any agency.

Start with one company

See the leaks in every company you own.