For franchise systems
Every location compared on one screen, checked against the money in the bank.
Franchisees run different phones, CRMs and ad accounts, and report their own numbers. We measure every location the same way and check it against QuickBooks.
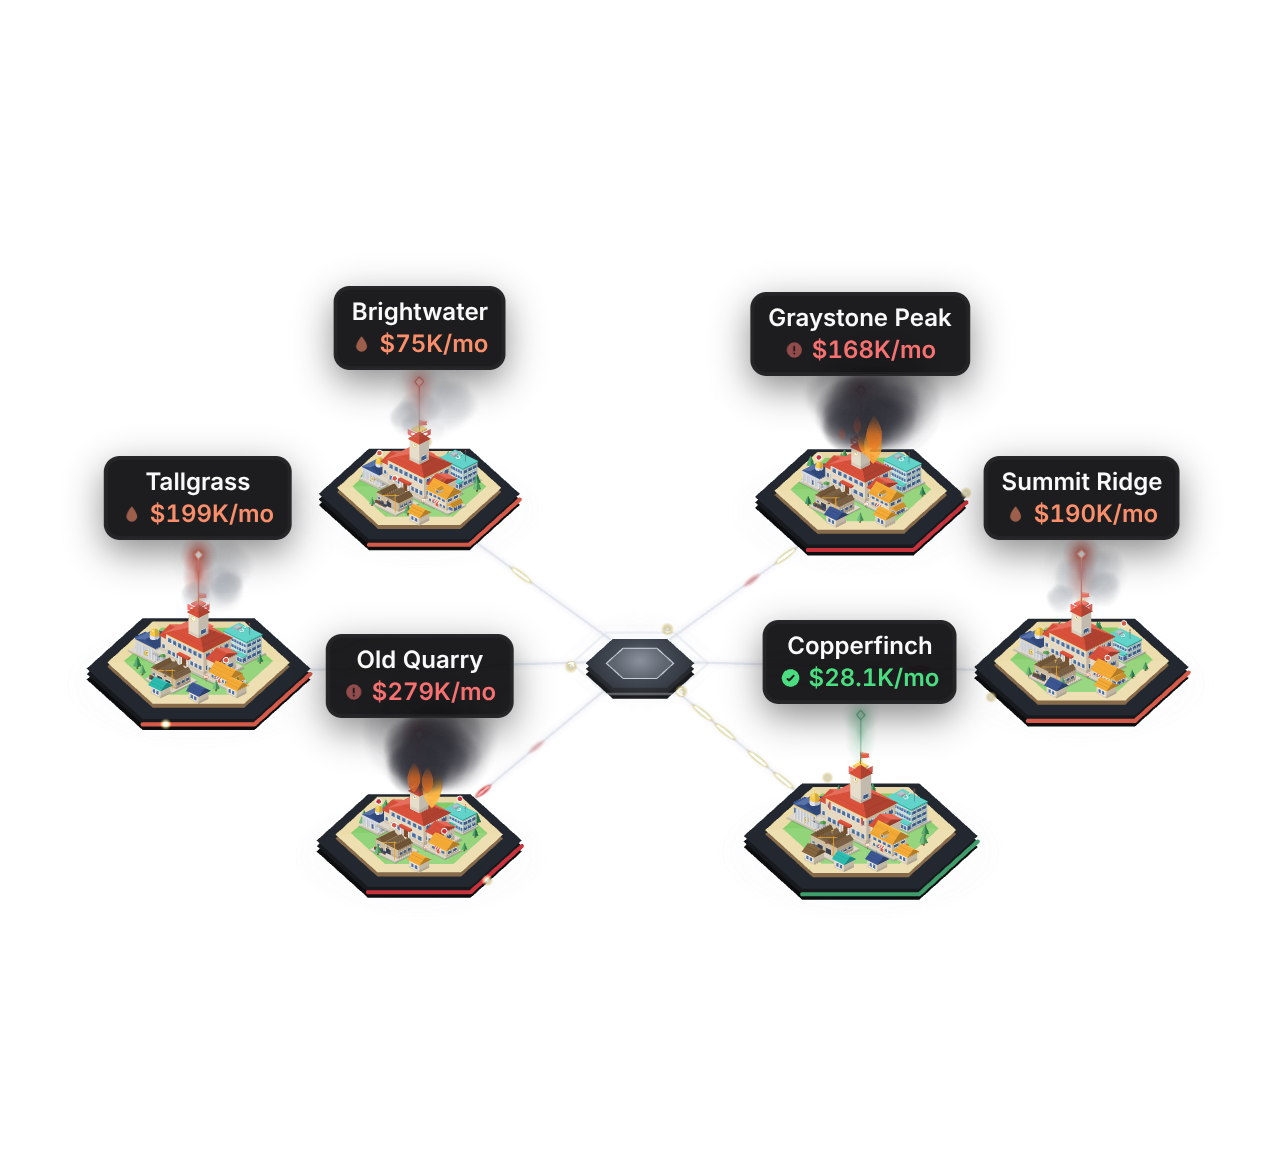
One definition for the whole network
A lead is a lead, a signed job is a signed job, at every location.
One lead per person per 7 days across calls, forms and lead services. Booked, signed, invoiced and collected, matched to the records. No more comparing spreadsheets that count differently.
- Benchmarks inside your network. Booked rate, close rate and cost per signed job for every location, side by side.
- Coaching with proof. Missed calls nobody returned and estimates going stale, by location, with the records behind them.
- Wins you can share. When a location fixes a leak, the before and after is in dollars, from the same definitions.
Single system vs every system
A single-system report tells you what the CRM says. We tell you what happened.
Each tool sees its own piece. We match calls, CRM jobs, QuickBooks invoices and ad spend, and find the jobs that fell between them.
What the CRM says
Looks fine. It only knows what someone typed into the CRM.
What actually happened
41 x 29% close rate x $14,200 average job = $168,838. Every line drills down to the records.
Ask it anything
Ask a plain question. Get the answer with its receipts.
Every answer shows the records it used: the calls, the CRM jobs, the invoices and the ad spend, each one linked, plus the dollar figure, the math, and the fix worth doing first.
- No number without a source. If the records don't support an answer, it says so.
- Same questions across every company. Ask about one company or the whole portfolio.
Why did Branch 2 sign fewer jobs in October?
Branch 2 signed 9 jobs in October, down from 15 in September. The gap is the phones, not the marketing: lead volume and ad spend were flat.
$57,652 at risk this month
14 unreturned calls x 29% close rate x $14,200 average job (base case)
Every number drills down
Click any dollar figure. See the exact calls and jobs behind it.
No black boxes. Every leak opens to its records and the assumptions used, so your office manager can check it and your rep can fix it the same day.
Connects to what you already run
Read-only connections to the software you already pay for.
Nothing to replace and nothing for your team to learn. We read; your systems stay exactly as they are.
Security
Built so your IT person and your CFO can say yes.
The short version is below. The details are on the security page.
Read-only
We read from your systems. Writes happen only where you turn them on: booked and signed jobs to your own Google Ads account with your written OK, and CSR Assist updates that a rep approves one by one.
Encrypted credentials
Logins and tokens are encrypted at rest and never shown back to anyone.
Tenant isolation
Row-level security in the database keeps each company’s data visible only to its own team.
Access logs
Exports, report downloads and views of leak records are logged.
Your data, exportable
Export all of your normalized data as CSV with a documented schema, any time.
Subprocessors listed
We never send your data to a third party that is not on our published list.
Not an audit. This is an operational and marketing analysis. It is not an audit, a quality of earnings report, or a financial opinion.
Start here
See your network on one screen.
Start with a handful of locations. Read-only, no change to the software your franchisees run.
- 1
Read-only accessOr the exports you already have.
- 2
We pull the last 90 daysEvery call, form, job and invoice, matched.
- 3
You get the dollar figuresWith the records behind each one. Month to month, no long contract.